The Weatherstar 4000+ project has been a lot of fun to work on. And it received a huge boost the week of May 26, 2025 when it made the front page of Hacker News, and then to other social media sites. The outpouring of nostalgia for these forecasts and visuals has been incredible to follow along with. There were so many people sharing memories of vacations, childhood, parents and grandparents and many other great things. Thank you to everyone who has become a fan of this project.
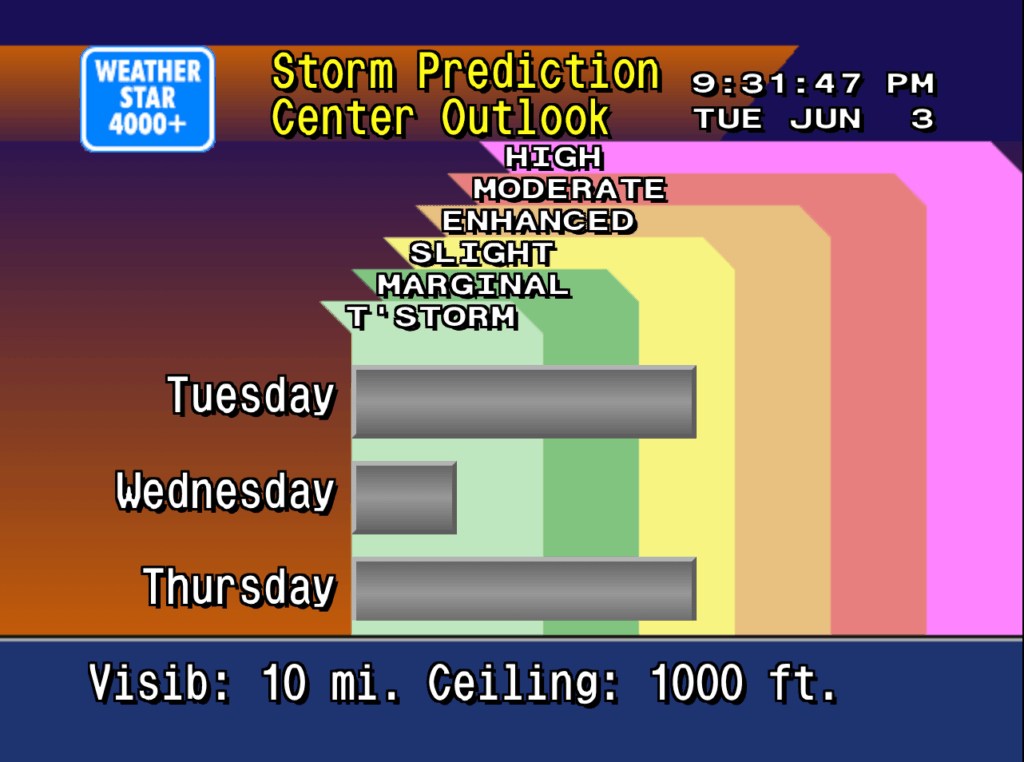
Just a few weeks prior to the huge bump in traffic I added a new screen to the Weatherstar, similar to the Hourly Graph and Hourly Forecast I previously added. This time I took the original air quality report, which is not in the Weatherstar 4000+ because the data for it is not available in the APIs I use for weather data, and re-worked it to share the three day Storm Prediction Center (SPC) Outlook. It shows the likelihood of severe weather over the next three days.

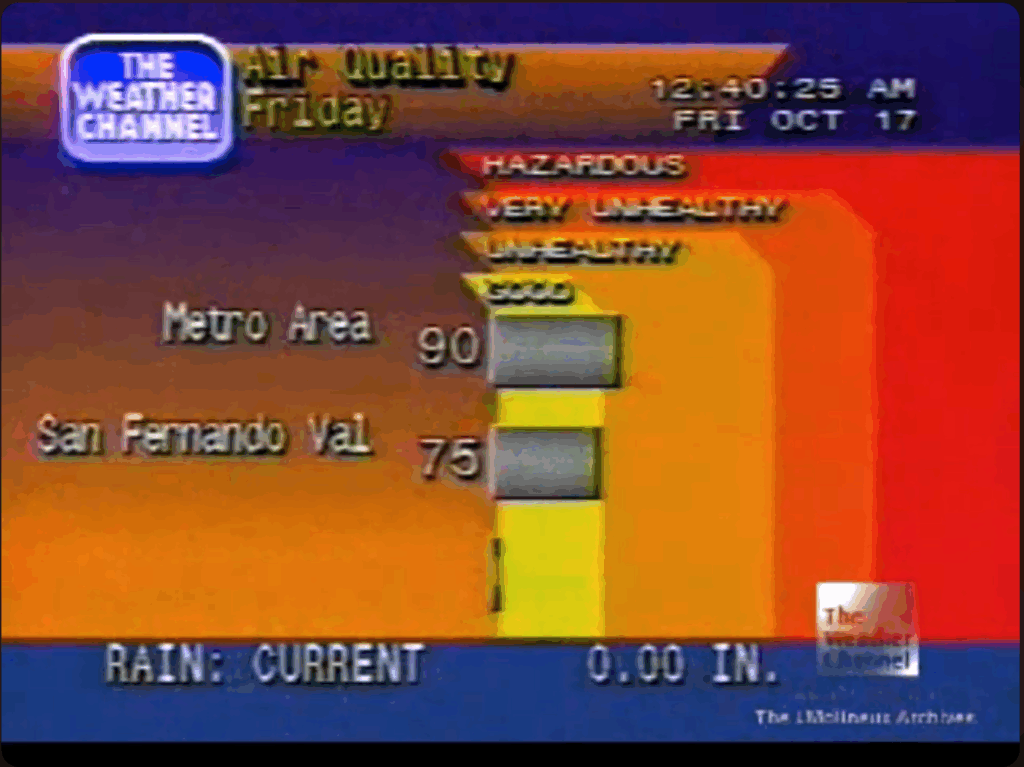
The design of this new screen follows very closely with the design of the air quality display from the original Weatherstar hardware. The number of categories have been increased to match the SPC’s categories, and the color coding comes directly from the SPC generated maps which look authentic in the context of the Weatherstar. Three days are shown which takes the place of up to three cities that the air quality report would include. Some slight visualization adjustments were also added to help make the category and color linking easier to follow.
You can see the similarities and differences between the new screen and the screen capture of the original air quality display below.

Please join the discussion at GitHub if you have questions or comments on the new screen.