In addition to the free forecast and observation data that powers Temperature.Express, the National Weather Service also makes available live and archive data from their NEXRAD weather radar network. This data dates back to 1991. I have created npm packages for parsing and plotting this data. [Jump to packages]
Level 2 Data
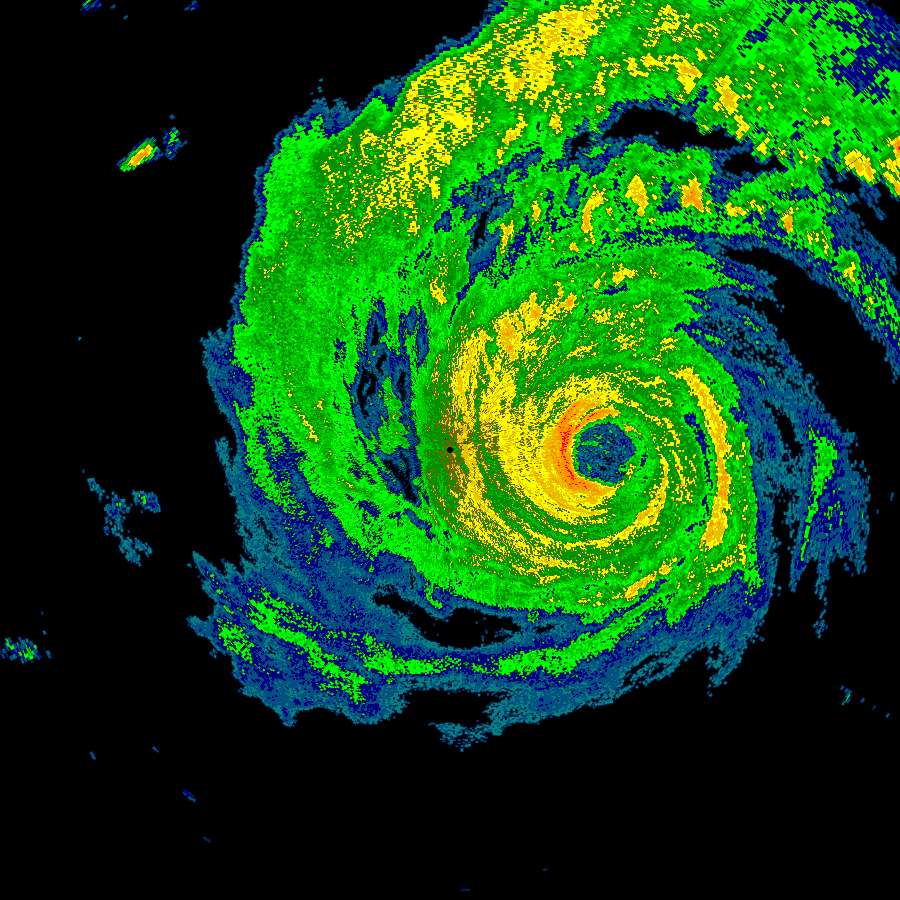
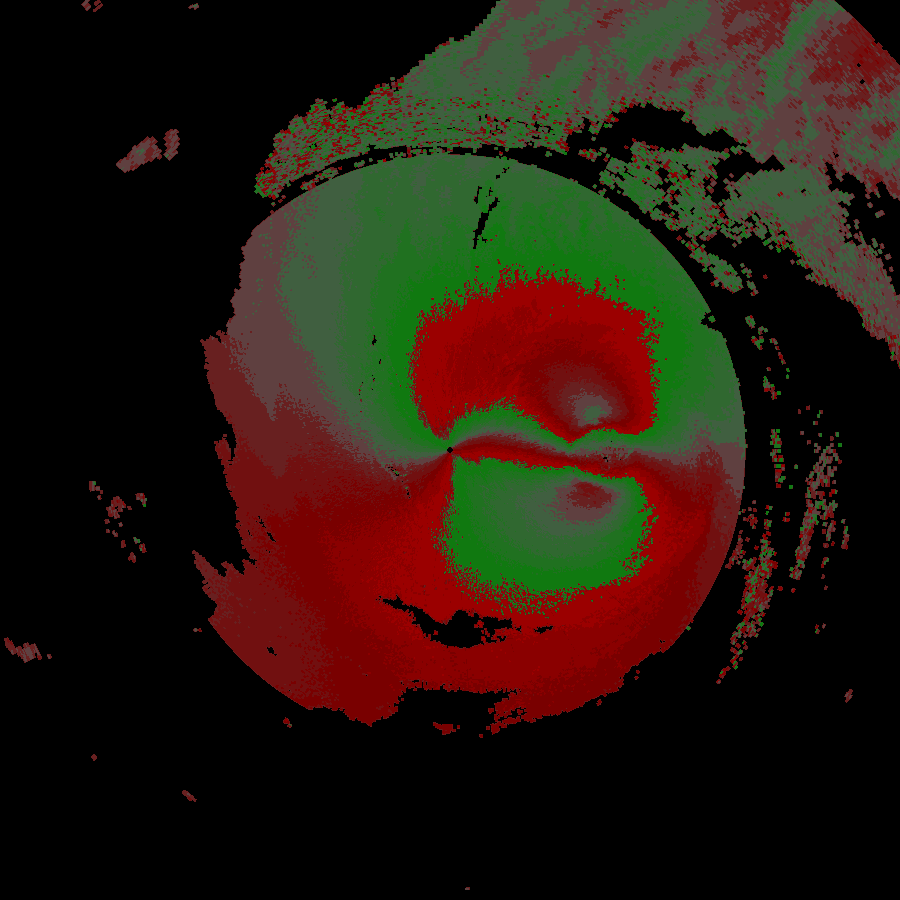
Level 2 data is what you’re used to seeing in your weather or radar app. It’s the “how hard is it raining” graphics typically in green, yellow and red with red being the heaviest or most severe precipitation. More advanced users will also recognize the red and green velocity plot that shows wind direction and intensity.
In 2019 I found nexrad-radar-data on Github. It worked, but needed some updating to to modernize the code and deal with the new compressed formats that were being stored to the archive. I then added plotting capabilities in a separate package. The results can be seen below.
A commercial tool exists for viewing this data, as does a set of libraries for Python. Neither of these options lent themselves to the environment where I was looking to deploy them. So I went ahead and began improving what was available to suit my needs.
nexrad-level-2-data is the direct descendant of nexrad-radar-data mentioned above and outputs a JSON object containing all of the data from one level 2 scan. An excerpt from this data is below. Additional information on how to make sense of this information including links to formal specifications from NWS are available in the Github repo.
{
  "elevation_angle": 0.4833984375,
  "channel_config": 2,
  "waveform_type": 1,
  "super_res_control": {
    "super_res": {
      "halfDegreeAzimuth": true,
      "quarterKm": true,
      "300km": false
    },
    "dual_pol": {
      "300km": true
    }
  },
  "surv_prf_number": 1,
  "surv_prf_pulse": 15,
  "azimuth_rate": 21.148681640625,
  "ref_threshold": 16,
  "vel_threshold": 16,
  "sw_threshold": 16,
  "diff_ref_threshold": 16,
  "diff_ph_threshold": 16,
  "cor_coeff_threshold": 16,
  "edge_angle_s1": 0,
  "prf_num_s1": 0,
  "prf_pulse_s1": 0,
  "supplemental_data": {
    "sails_cut": false,
    "sails_sequence": 0,
    "mrle_cut": false,
    "mrle_sequence": 0,
    "mpda_cut": false,
    "base_tilt_cut": false
  },
  "edge_angle_s2": 0,
  "prf_num_s2": 0,
  "prf_pulse_s2": 0,
  "ebc_angle": 0,
  "edge_angle_s3": 0,
  "prf_num_s3": 0,
  "prf_pulse_s3": 0,
  "reserved": 0
}
The changes were to the source repo were substantial. As I learned more about the newer radar formats it was necessary to go back and rework the core of the parser so that different message and compression types could be detected at the appropriate places. The data format is well documented but was designed in the 1980’s so there are a lot of less commonly used data structures compared to a modern system. The documentation makes significant use of “half-words” (16 bit values), and has a special floating point representation designed around the exact needs of the radar’s output. Some of the significant changes include:
- Looking for compression headers and passing data to a gzip decoder. Several gzip blocks might be present within one file and the parser detects these additional blocks and decodes them accordingly. This is not a standard gzip file format.
- In the mid 2010’s radar sites were upgraded with super resolution which more or less quadrupled the resolution of the data. This change puts all new data formats into the data files and the correct format needs to be determined before decoding can take place. The plotter also needs to identify the two types to scale the resulting images properly.
- When using live data, it is delivered as “chunks” that are typically 1/6th of a complete scan per file. Various methods were developed to combine multiple independent files and recombine it with header data that only appears in the first file in the series.
- The data coming from the radar is not perfect. After running the parser and plotter in a production environment for a year, several errors would repeat themselves. Careful analysis of the problematic files with a hex editor revealed truncated files, incorrect length pointers and missing slices of the scan. Best-effort methods were added to try and find the correct lengths, pointers and to flag missing slices.
Level 3 Data
Level 3 data is the result of compiling data across several minutes or hours, or text output of analysis algorithms that flag hail, rotation and other phenomenon. These different types of output are called products.
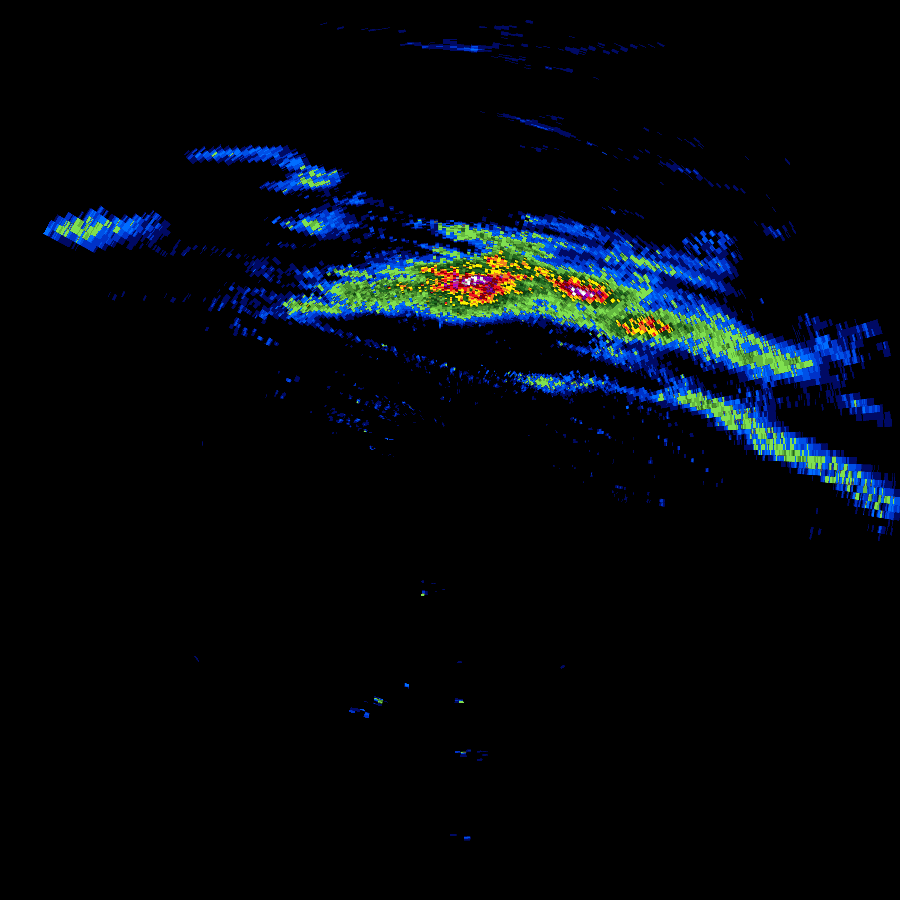
This data takes on a completely different format from level 2, and for several of the products does not even produce data that can be plotted. Below is the output of Digital Total Accumulation which acts as a digital rain gauge, estimating the amount of rain that has fallen during a thunderstorm event at any point within the radar’s area.
Even with the significantly different data format. A lot of techniques from the level 2 software could be leveraged to make decoding level 3 data a simpler task. Concepts like half-words and special floating point and fixed-point binary formats continued to exist.
Other data that is stored in the level 3 format is text-only and may be presented as the pre-formatted text shown below, or in a more structured form that lends itself to a JSON output.
                                STORM STRUCTURE
     RADAR ID 552   DATE/TIME 04:19:21/19:02:24   NUMBER OF STORM CELLS  24

   STORM      AZRAN      BASE     TOP    CELL BASED VIL    MAX REF    HEIGHT
     ID      DEG/NM       KFT     KFT       KG/M**2          DBZ        KFT

     D6      120/ 63    < 6.5    19.6          29             57       15.1
     P2      165/ 83    < 9.7    21.6          22             54       12.6
     T9      190/ 94    <11.7    19.9          21             53       11.7
     U3       78/100    <12.8    27.3          21             52       12.8
     H8      109/159    <27.5    33.5          20             49       27.5
     T6      125/138    <21.5    34.6          19             49       21.5
     C2      114/ 97    <12.2    21.0          19             52       12.2
     K8      201/133    <20.4    25.1          18             50       20.4
     L9      152/ 79    < 9.0    20.1          15             50        9.0
     X0      194/106    <14.1    23.3          14             50       14.1
Level 1 Data
What about level 1 data? Level 1 data is only published as part of select case studies and not on a continual basis like level 2 and level 3. It is the raw data that comes back from the radar antenna in analog form. Upon receipt, it is processed immediately at the radar site into the digital level 2 format that is distributed through the National Weather Service’s various channels.
Acquiring Data
The data is available freely through different cloud providers. A good starting point is Nexrad on AWS which at the time of this writing appears to have the most complete level 2 archives, live level 2 chunks and level 3 data. This AWS source also provides notifications for new data in some of the buckets.
Summary
The complete suite of four npm packages consists of:
- nexrad-level-2-data, parses level 2 data files and returns them as a JSON object.
- nexrad-level-2-plot, plots data from the above package.
- nexrad-level-3-data, parses level 3 data files and returns them as a JSON object.
- nexrad-level-3-plot, plots data from the above package where applicable. Some level 3 data is tabular or text-only.